This study looks at ferry legs booked and confirmed through BookYourFerry for travel between June 2025 and July 2026. It describes our platform’s bookings, not the whole Andaman ferry market.
Every figure on this page is in our published data: monthly legs by route (CSV) and the booking-window summary (CSV).
Key findings
- The published monthly snapshot covers 22,314 confirmed ferry legs with travel dates from June 2025 to July 2026. July 2026 is partial, covering travel up to 26 July 2026.
- Monsoon months averaged about 717 legs a month. June to September 2025 brought 2,869 legs over four months.
- Peak months averaged about 2,837 legs a month. October 2025 to February 2026 brought 14,183 legs over five months.
- So the monsoon average ran at about a quarter (25%) of the peak-season average.
- July 2025 had 315 legs, 8% of December 2025’s 3,959. December ran roughly 12.6 times July.
- Routes didn’t change evenly. Havelock → Port Blair kept 43% of its peak monthly volume through the monsoon. The two legs involving Neil Island kept about 19% each.
- How far ahead people booked shifted with the season. 56% of bookings made in June were for a first sailing within 48 hours. Of bookings made in September, 16% were, and the median booking was about three weeks ahead.
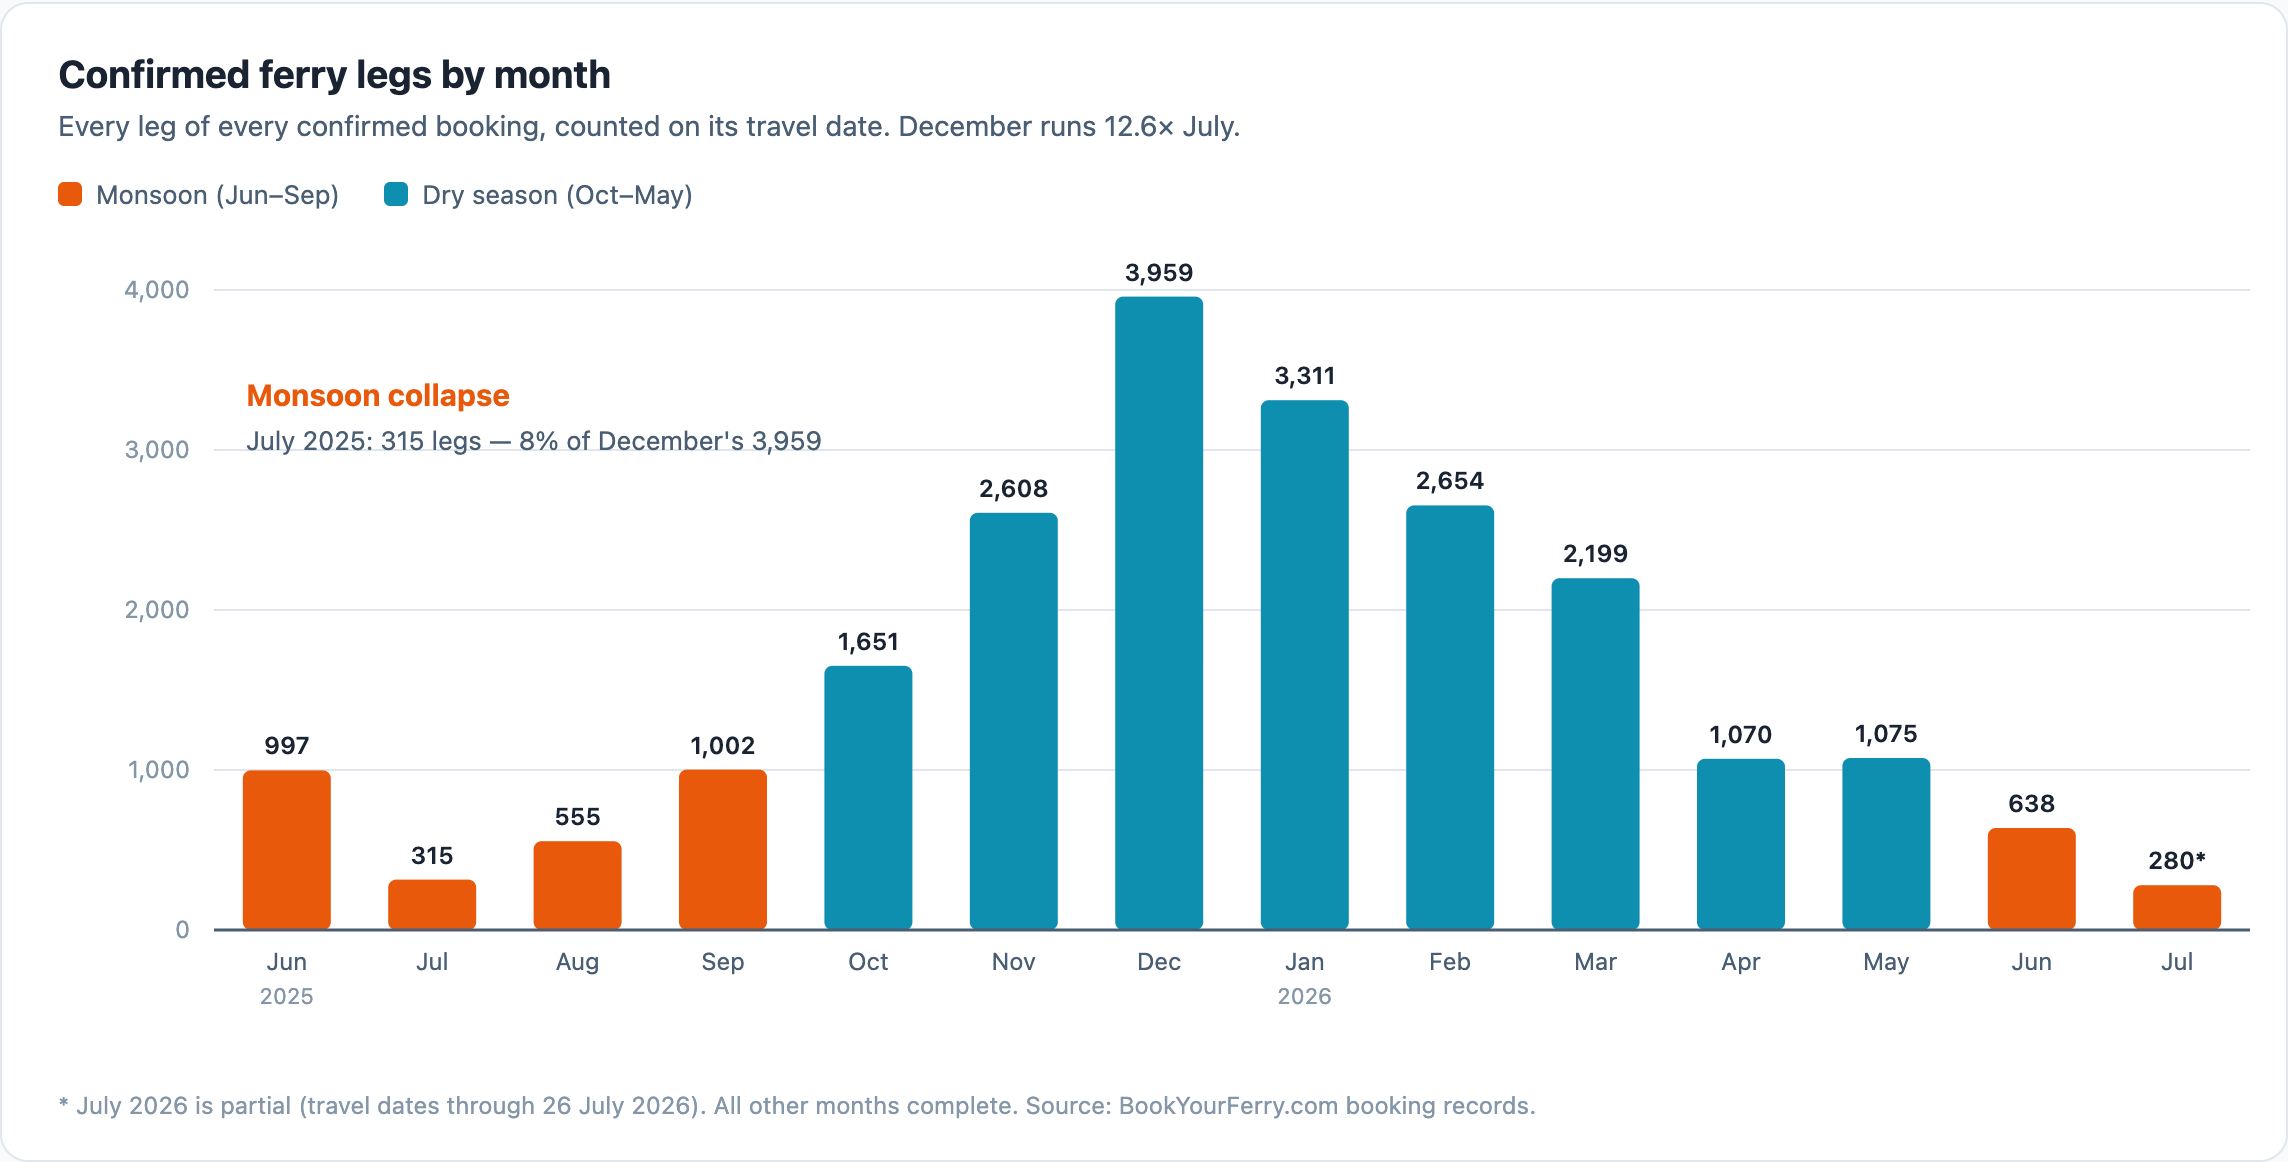
Monthly averages, not season totals
The 717 and 2,837 figures are averages per month. They aren’t totals for each season.
| Period | Months | Confirmed legs | Average per month |
|---|---|---|---|
| June–September 2025 (monsoon) | 4 | 2,869 | 717 |
| October 2025–February 2026 (peak) | 5 | 14,183 | 2,837 |
These are booking volumes on BookYourFerry. They don’t count sailings operated, seats, passengers, ferry capacity or market share.
Which routes held up through the monsoon
Here’s each route’s monsoon average (June–September 2025) as a share of its own peak-season average (October 2025–February 2026):
| Route | Monsoon, per month | Peak, per month | Monsoon share of peak |
|---|---|---|---|
| Havelock → Port Blair | 173 | 405 | 43% |
| Port Blair → Havelock | 281 | 1,050 | 27% |
| Havelock → Neil Island | 138 | 718 | 19% |
| Neil Island → Port Blair | 121 | 655 | 19% |
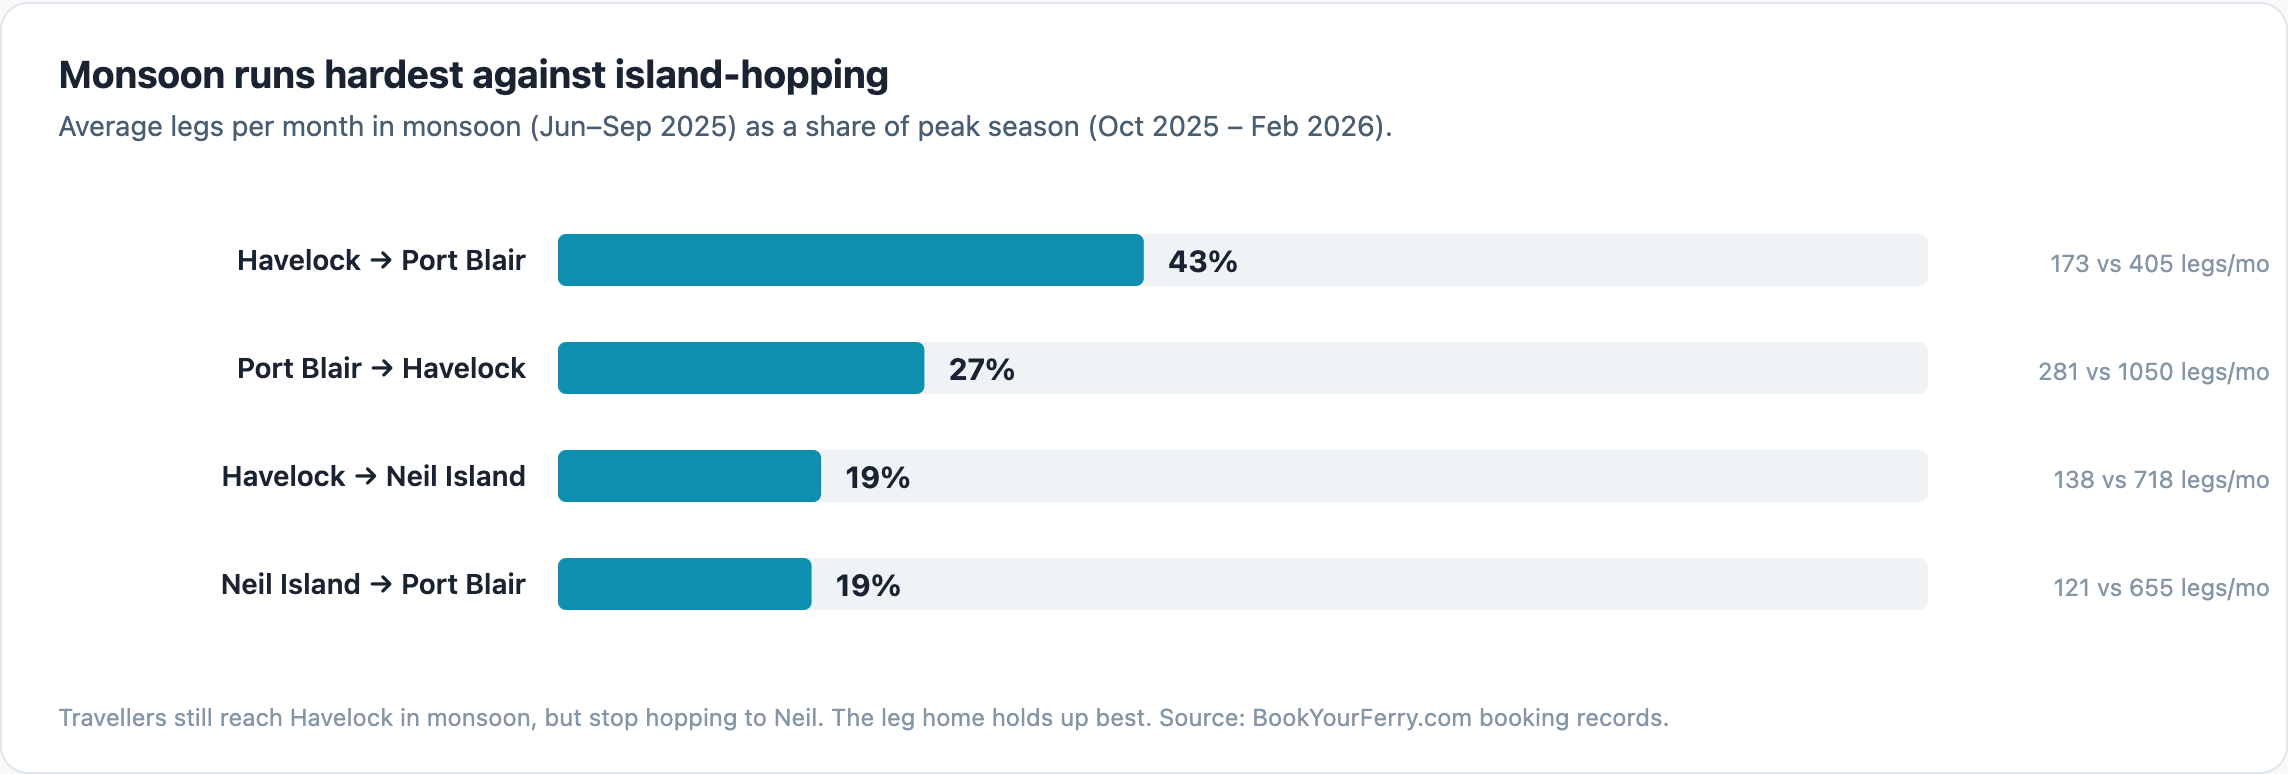
The journey back to Port Blair held up best in our bookings. Both legs involving Neil Island fell furthest, each keeping about a fifth of its peak volume. And the main Port Blair to Havelock route sat in between.
The data shows what changed, not why. Weather, fewer sailings, fewer visitors and simpler itineraries could each play a part, and we haven’t separated those causes.
How far ahead people booked
This part measures how long before their first sailing travellers booked. It covers 3,967 confirmed bookings made on BookYourFerry between 10 April and 23 September 2026.
| Booked in | Bookings | First sailing within 48 hours | Median time ahead | Booked 14+ days ahead |
|---|---|---|---|---|
| April 2026 (from 10 April) | 547 | 44% | 2.8 days | 16% |
| May 2026 | 1,194 | 49% | 2.1 days | 16% |
| June 2026 | 696 | 56% | 1.7 days | 14% |
| July 2026 | 372 | 37% | 5.3 days | 38% |
| August 2026 | 395 | 28% | 14.8 days | 51% |
| September 2026 (to 23 September) | 763 | 16% | 21.9 days | 60% |
More than half of the bookings made in June were for a ferry leaving within 48 hours. By September that had fallen to 16%, and half of all bookings were at least three weeks ahead.
That describes when people booked, not how every peak-season traveller plans. Most bookings made in September are for trips between October and December. The short-notice bookings for those trips haven’t been made yet.
One route stands out. When a booking started with Havelock → Port Blair, usually a traveller already on Havelock booking the trip back, 61% sailed within 48 hours and the median booking was 1.4 days ahead. Bookings that started with Port Blair → Havelock, Havelock → Neil Island or Neil Island → Port Blair had medians of about six days.
What this means if you’re planning a trip
A quiet month on our platform can’t tell you whether your ferry has seats. Always check current availability for your exact route and date.
- Travelling June to September? Take extra care with island-to-island plans. Bookings on the legs to and from Neil Island fell furthest, so check those sailings before you book hotels on Neil. The Havelock to Neil Island ferry guide covers that route.
- Travelling October to February? Our bookings ran at roughly four times the monsoon level. Use the ferry schedule to compare departure times, then search your date.
- Still choosing when to go? The best time to visit the Andamans guide covers weather, crowds and ferries month by month.
Method
- Source: confirmed bookings made through BookYourFerry, a Port Blair-based private-ferry booking service.
- Unit: a leg is one sector (one route on one travel date) of a confirmed booking, counted by travel date, not booking date. A return trip counts as two legs. A leg isn’t a passenger count.
- Window: travel dates from June 2025 to July 2026. July 2026 is partial, so it’s left out of both seasonal averages.
- Seasons: “monsoon” means June–September 2025 and “peak” means October 2025–February 2026. They’re calendar groupings for comparison. The data doesn’t measure weather.
- Route shares divide each route’s seasonal totals before rounding, so they match the CSV exactly.
- Booking window: the time from a traveller reaching payment to the scheduled departure of their booking’s first sailing, in elapsed hours (IST). It uses timetable times, so delays aren’t counted. Each booking counts once, even for a multi-leg itinerary. It covers bookings made from 10 April 2026, when this record begins, and only bookings that were confirmed.
- Limits: this is one platform’s bookings. It leaves out government ferries and tickets bought directly from operators or other agents. It isn’t a measure of market share, ferry capacity or demand across the islands.
Correction to earlier figures
Some coverage of this study, published between 21 and 23 September 2026, cites a total of 34,868 ferry legs and booking-window figures, including “42% of seats booked within 48 hours of sailing”. We withdrew those figures on 17 September 2026. The 34,868 total isn’t part of this study.
We recalculated the booking-window figures on 24 September 2026, counting bookings rather than seats and elapsed hours rather than calendar days, and separating multi-leg itineraries. The results in How far ahead people booked replace the earlier figures. One earlier claim didn’t survive: Havelock → Neil Island and Port Blair → Havelock bookings don’t differ in how far ahead they’re made.
Data and citation
- Monthly legs by route: seasonality.csv
- Booking window by month and route: booking-window-2026.csv
- Our wider open dataset of operators, routes and fares: Andaman Islands Ferry Dataset
Suggested citation: BookYourFerry (2026). Andaman Ferry Seasonal Patterns 2026: booking data, June 2025–July 2026. https://www.bookyourferry.com/andaman-ferry-seasonal-patterns-2026
Media and methodology questions: vivek@bookyourferry.com